Global Users Preferences for Android Phones, Q2 2021
Posted:
, by:Antutu
page views:
![]()
The second quarter of 2021 has ended, the hot summer is coming, and the layout of major mobile phone manufacturers in the first half of the year has been completed. Today, we have worked out the user preference ranking list in the second quarter of 2021 based on the backstage data of Antutu. What kind of mobile phones do Antutu users prefer? Let's have a look at the ranking list.
It should be noted that this preferences list is prepared based on the phone configuration of the users of Antutu and thus it does not represent the preferences of the overall Android market.
Screen Size
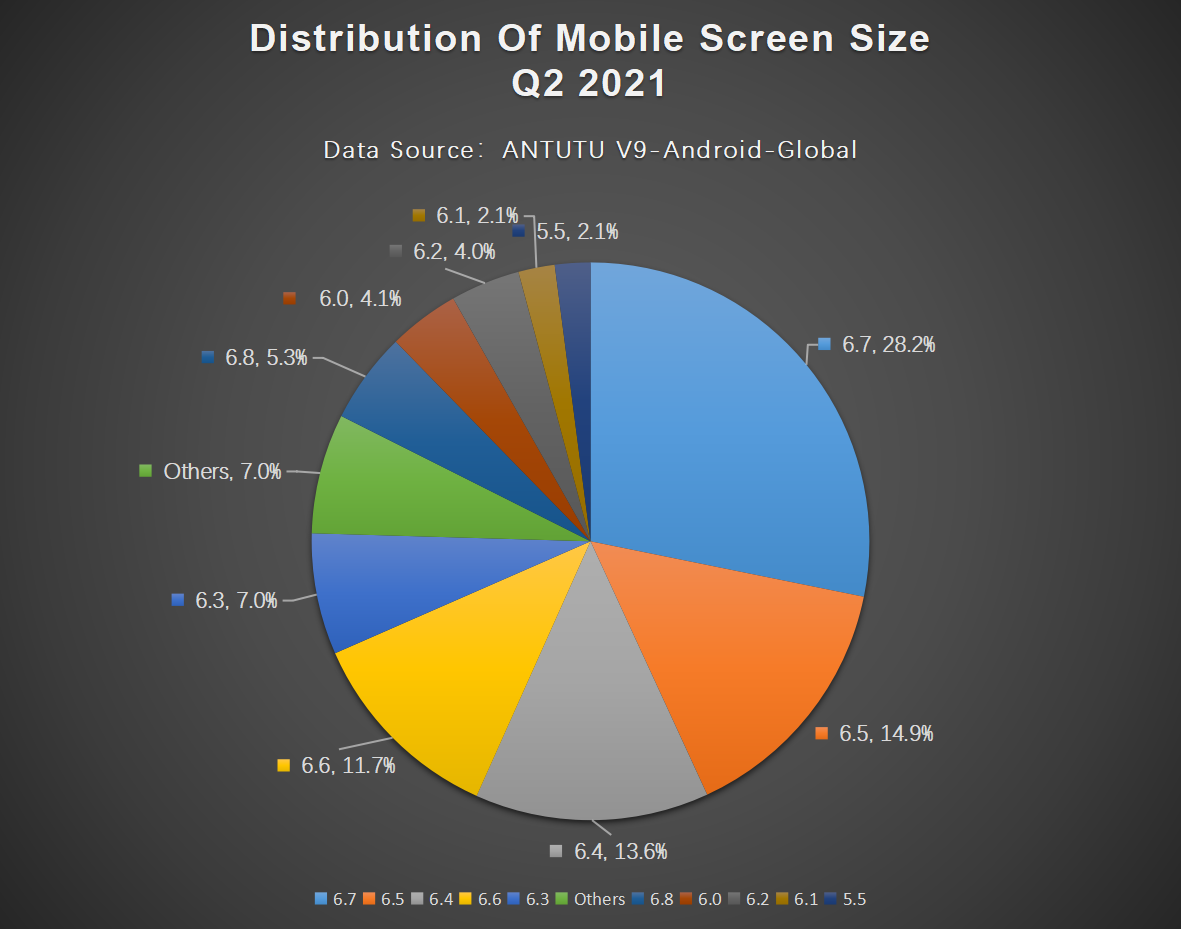
In the second quarter of 2021, the preferred screen size of smartphones expanded again, and the 6.7-inch screen became the mainstream (it was 6.5-inch in the first quarter), accounted for 28.2% of the total, 12.9 % higher than that in the first quarter, which is a very large growth rate.
The 6.5-inch screen, which accounted for the largest share in the first quarter, fell by 1.1% in Q2. Although the change is not big, the increasing demand of users for the large screen can still be clearly seen.
The share of other screen sizes didn't change that much. It should be the users of some old models. If they would like to change their mobile phones in the future, there are no other options left but products with more than 6.5-inch screens.
In the second half of this year, with the emergence of the new under-display camera, the size of the mobile phone screen will also usher in a real full-screen era. What will happen to the screen size then?
Screen Resolution
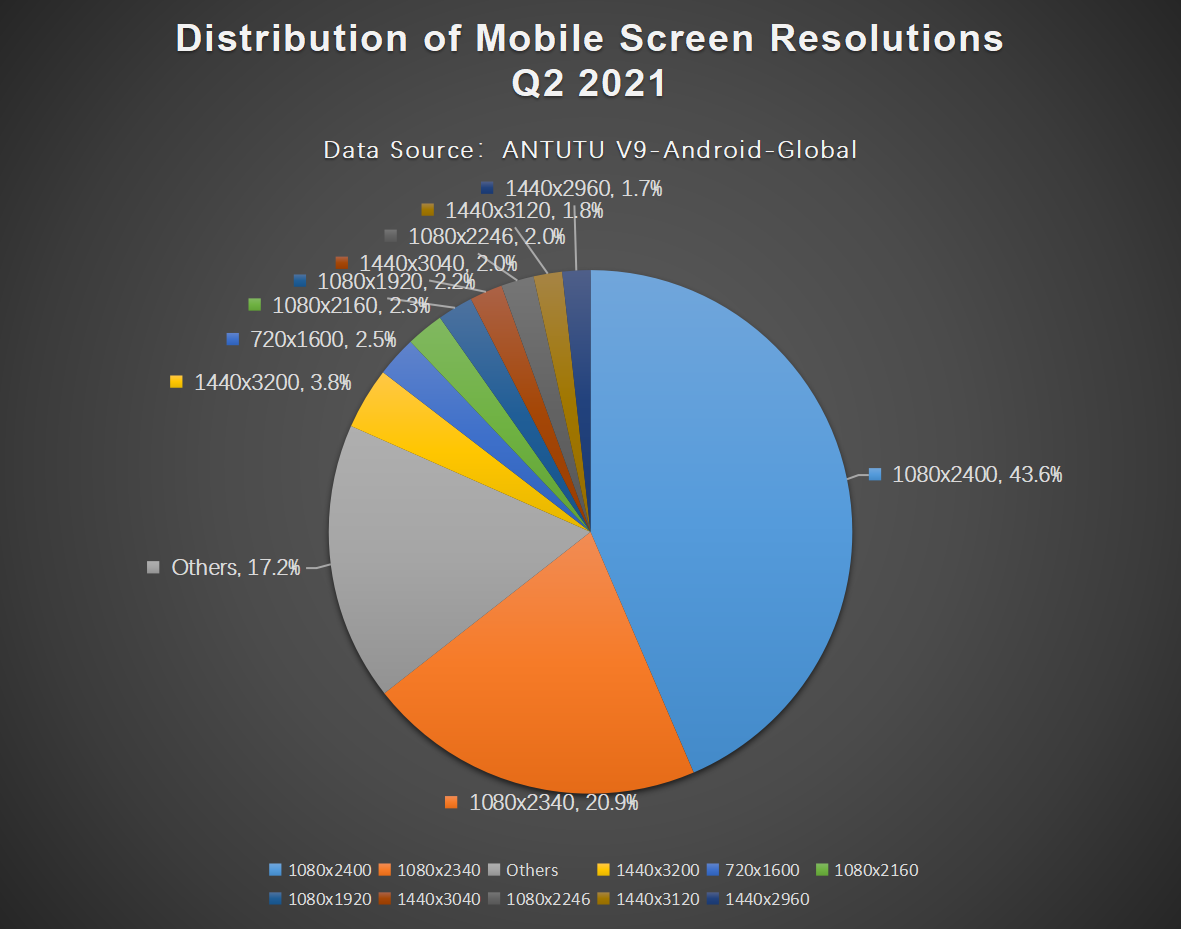
According to the ranking list issued in Q1 of 2021, the phones with a screen resolution of 1080×2400 accounted for 31.1%, which means this is the resolution for more than one-third of the screens. From this distribution chart of Q2, we can see that the share of this resolution continued to increase and reached 43.6%. This figure is expected to rise to 50% shortly.
However, only increasing the resolution doesn't have much of a direct effect on the human eye now. For products with small screen sizes, 1080P is good enough to see no dot particles on the screen. In contrast, enhancing the sliding effect of the touch screen is a more effective way to bring quality improvement. So from now on, we will also bring you the data of screen refresh rate.
Screen Refresh Rate
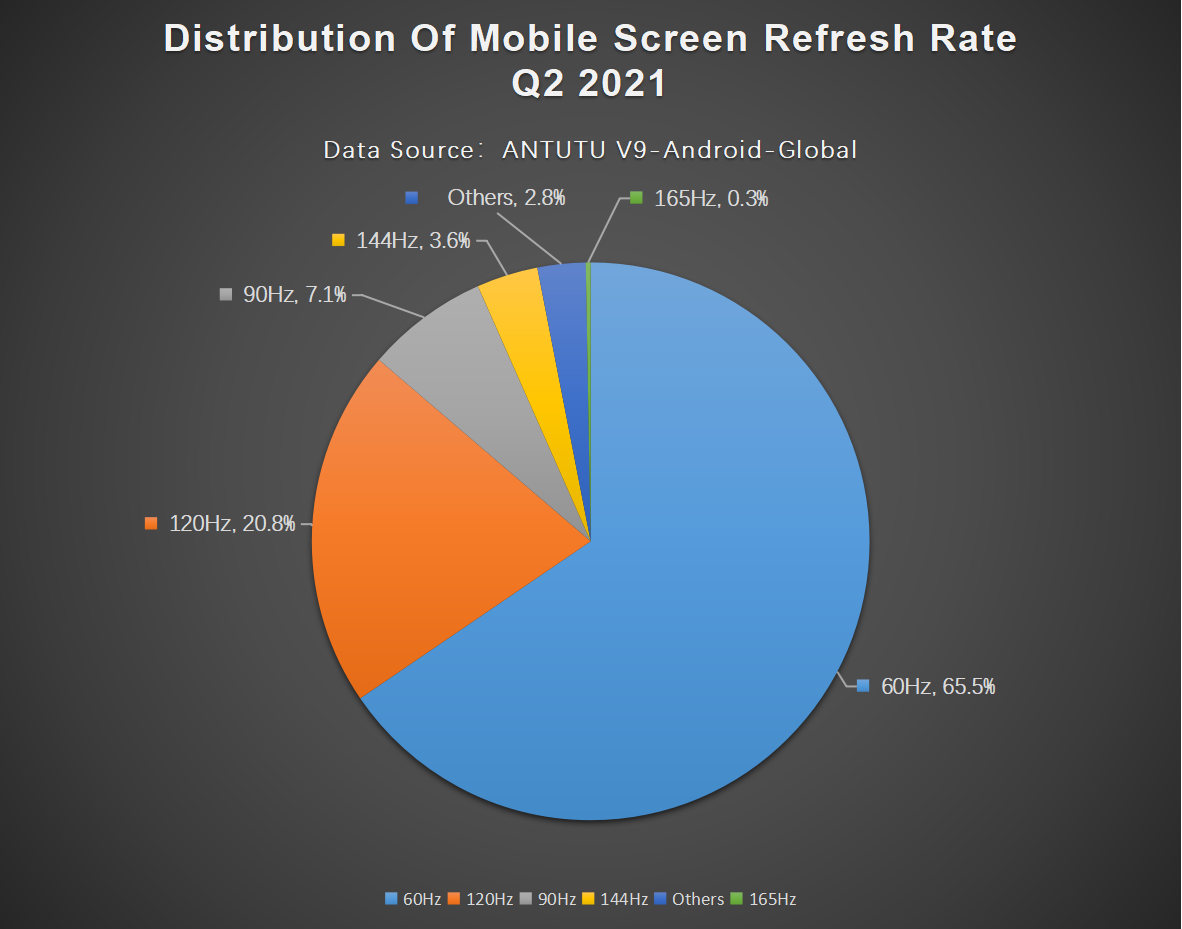
There is no previous data for reference and comparison since it is the first time adding the data of screen refresh rate.
As we can see from this distribution chart of Q2, the 60Hz refresh rate is still mainstream in the current market, accounting for 65.5%, followed by the 120Hz refresh rate, which accounted for 20.8%. The 90Hz refresh rate, which was supposed to be the second-highest, only ranks third, accounting for 7.1%.
Increasing the refresh rate from 60Hz to 90Hz is a qualitative change and the effect is huge. However, upgrading from 90Hz to 120Hz is just a routine growth, the effect is not as obvious as that from 60Hz to 90Hz.
It is interesting to see that the refresh rate has been stabilized at 120Hz because of the fierce competition in the mobile phone market, 90Hz becomes a transition. We are afraid only the current market can make such rapid progress.
In addition, there are also some products with 144Hz and 165Hz refresh rates, most of them are game phones, which are pursuing higher standards.
Processor Brand
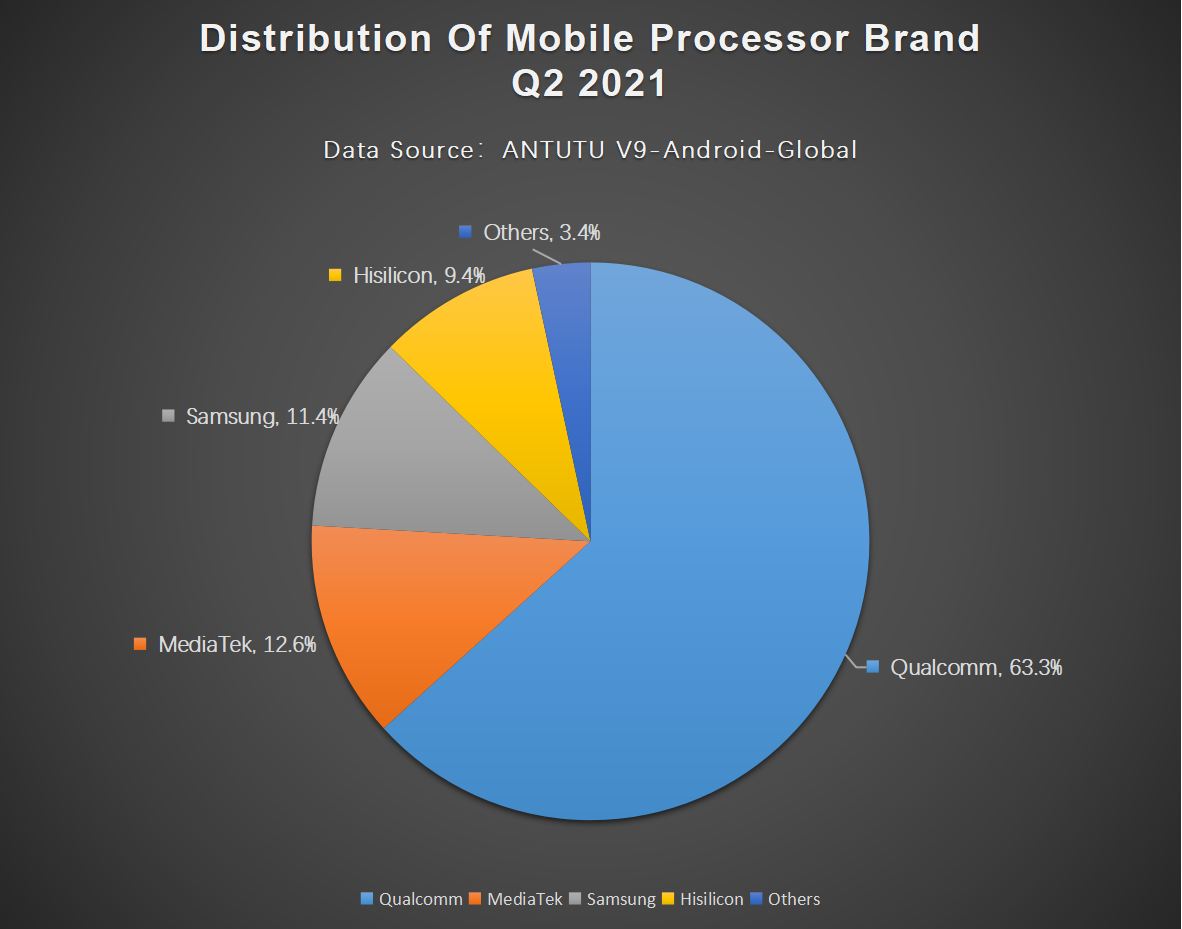
In terms of processor brands, Qualcomm increased by 5.4% compared with the first quarter of this year, accounted for 63.3% of the market, ranked first.
MediaTek continued to show a downward trend compared with Q1, with a decline of 1.9% this time, accounted for 14.5%, ranked second. Samsung also saw a decline of 2.8%, accounted for 11.4%. Huawei Hisilicon accounted for 9.1%, with a further decline of 1.5% compared with the first quarter.
So on the whole, except for Qualcomm, the market shares of the other three are all falling. Although everyone calls the Snapdragon 888 the new generation of “Fire Dragon”, there is still no product that can replace its performance at present. Even if you don't like it, you still need to use it.
Processor Cores
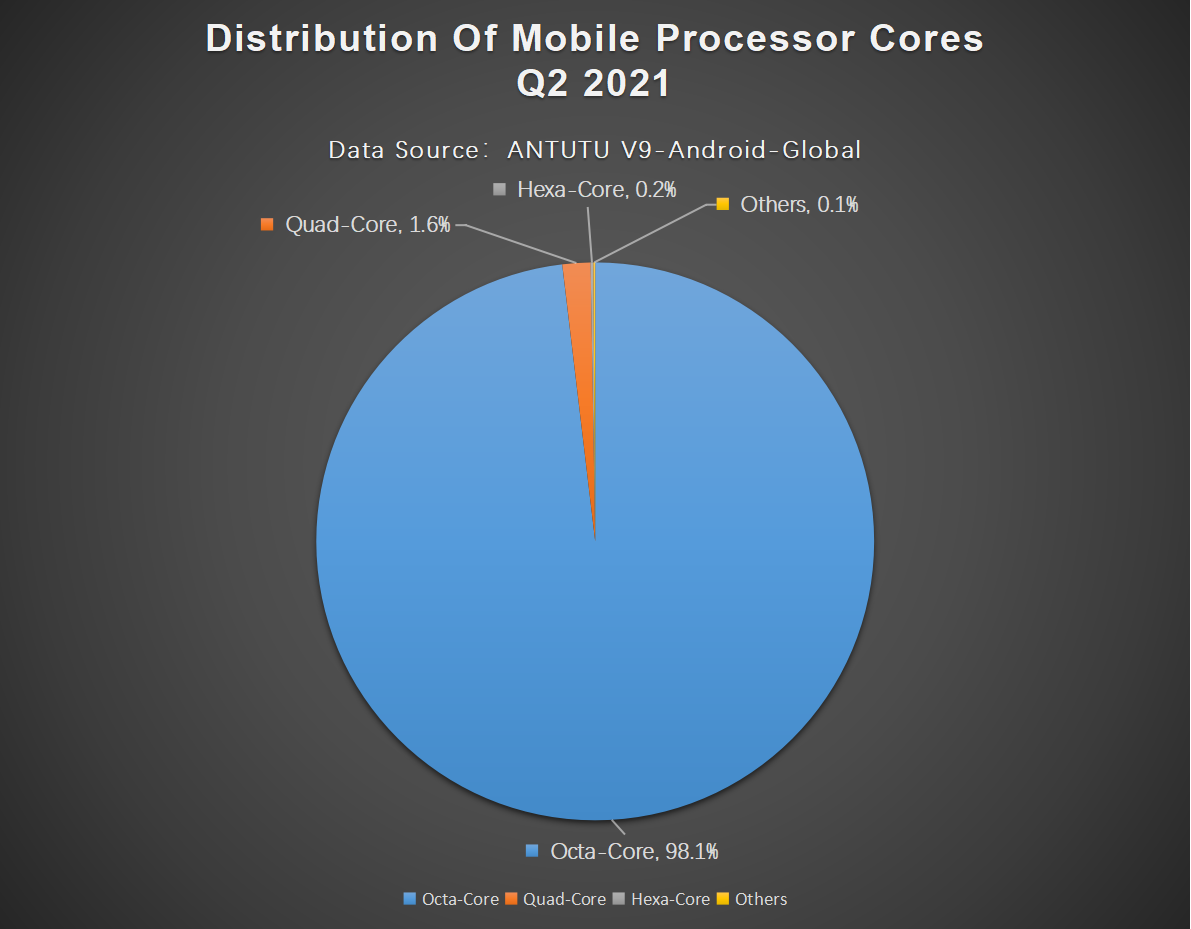
Compared with the first quarter of this year, the share of 8-core mobile phones continued to rise by 1.4%, reached 98.1%, and it is about to get the ultimate figure of 99%.
It is not likely to get 100%, because there are always some users using those old products, it is very meaningful to see the changes of an era from mobile phones, as we can see there are still many people using Nokia now.
RAM Size
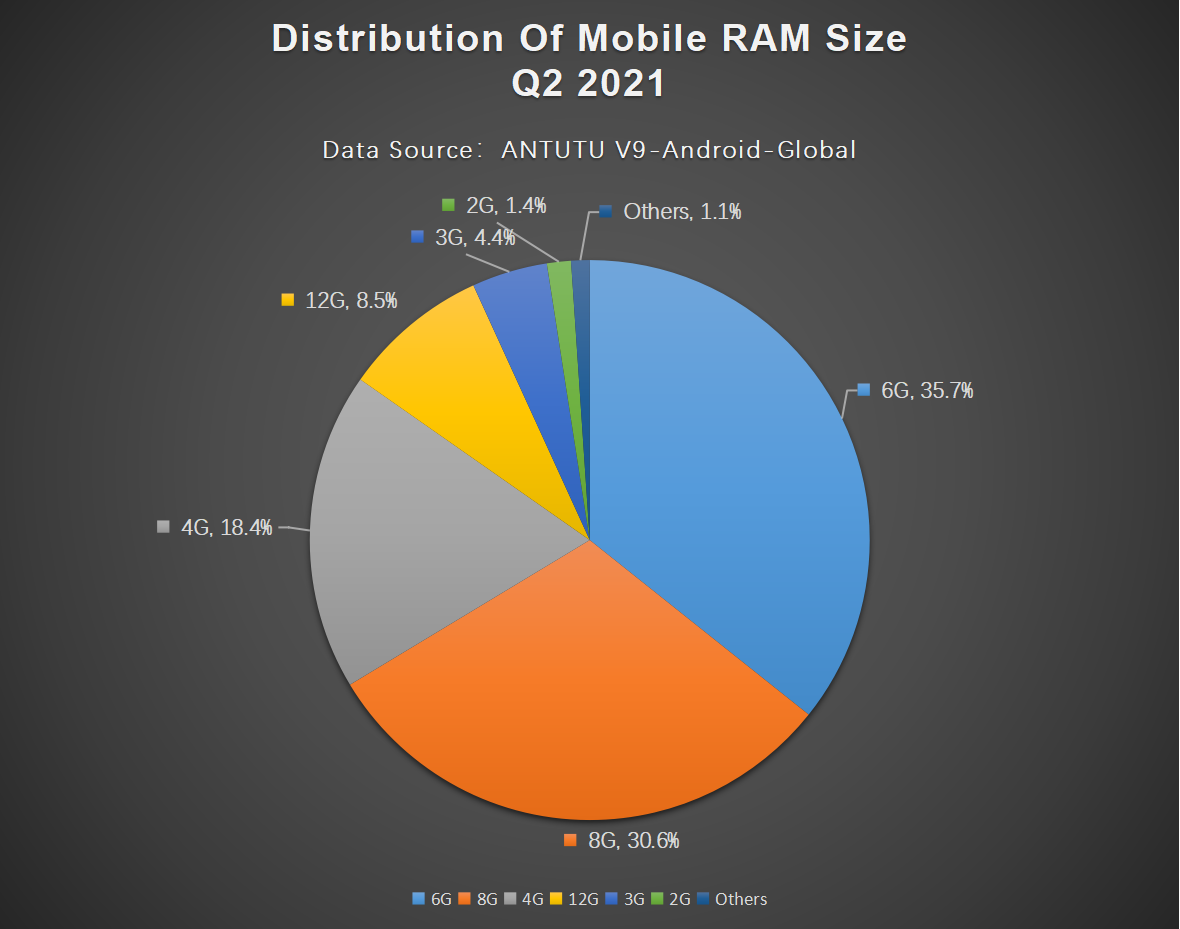
4G RAM increased the most compared with the first quarter of this year, increased by 7.1%, accounted for 30.6%. The second was 6G RAM, which increased by 2.6%, accounted for 33.1%.
The sum of these two RAM versions is more than 60%, which shows that there are still a large number of middle and low-end mobile phones in the market. However, with the increase of the mobile phone processor, screen resolution, refresh rate, and other configurations, the RAM size will not be small in the future.
ROM Size
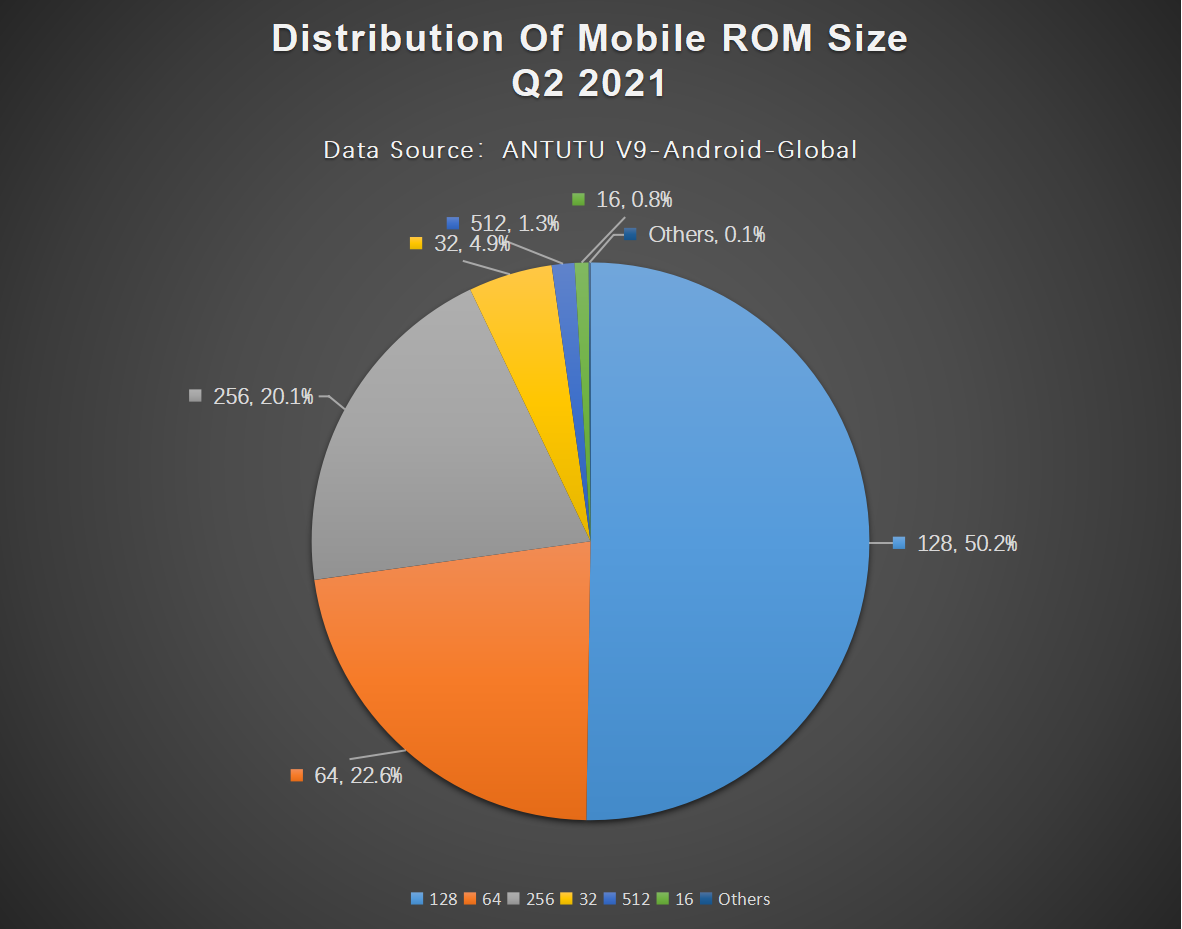
In the aspect of memory capacity, the share of 128GB ROM continued to increase and reached 50.2% in Q2, up 4.2% from the first quarter. 128G, as the starting ROM that is very suitable for mobile phones, finally accounted for over 50%, which is good news for many users who have this demand.
Another significant increase was 256GB ROM, which increased 6.6% from the first quarter of this year to 20.1%, the largest increase in the table.
In contrast, the share of 64GB ROM and 32GB ROM decreased by 5.8% and 3.7% respectively, which were the two most significant declines.
As we mentioned before, with the increase of various configurations of mobile phones, the storage space will increase as well. When a 100 million pixel camera is available on a 1,000RMB+ mobile phone, the storage capacity needs to be at least 128G.
Android Versions
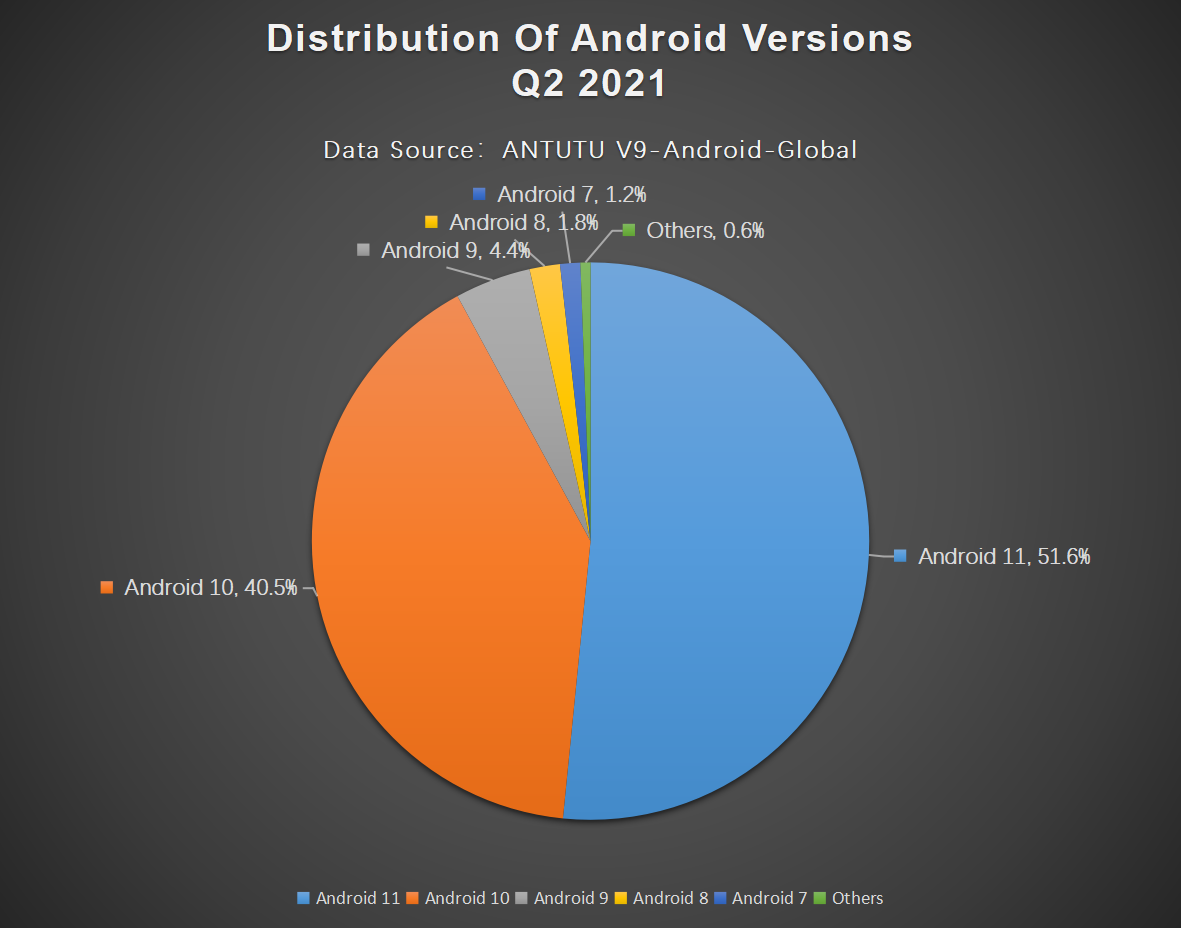
According to the distribution chart, Android 11 became the largest market share in Q2, with a 29.5% significant increase compared with the first quarter, which accounted for more than half of the total, reached 51.6%.
With the increase of the share of Android 11, the most significant decline was Android 10, which fell 23.4% and accounted for 40.5%.
Although the share of Android 10 is still huge, it is clear that Q1 Android 10 users have upgraded to Android 11, which is a win-win situation for both mobile manufacturers and users.
In addition to the growth of Android 11, all the share of other versions fell in Q2, from which we can see that users will upgrade whenever a new version is available and supported by the phone.
The above is the overall picture of Antutu's global user preference ranking list in Q2 of 2021. Compared to the data of Q1, the overall trend is still faster, stronger, and updated. Moreover, we have also included the screen refresh rate data for the first time, so you can also see more detailed competition in various aspects of Android phones.
It should be noted again that the ranking list only represents the preferences of Antutu users rather than the configuration distribution of the overall Android mobile phone market.